
Speaking Data Fluently: A Guide for Modern Data & AI Practitioners
For busy data/AI builders, marketers, and sellers: Keep this guide handy and share it - help your team spend less time untangling terms and more time delivering value.
The Data Language Barrier
Naming is a mysterious science.
Take compute service - a fundamental cloud offering that every provider has. Amazon Web Services (AWS) calls it EC2, Microsoft Azure and Oracle stick with 'virtual machine', while Google opts for 'compute engine' – all for essentially the same concept of a compute service.
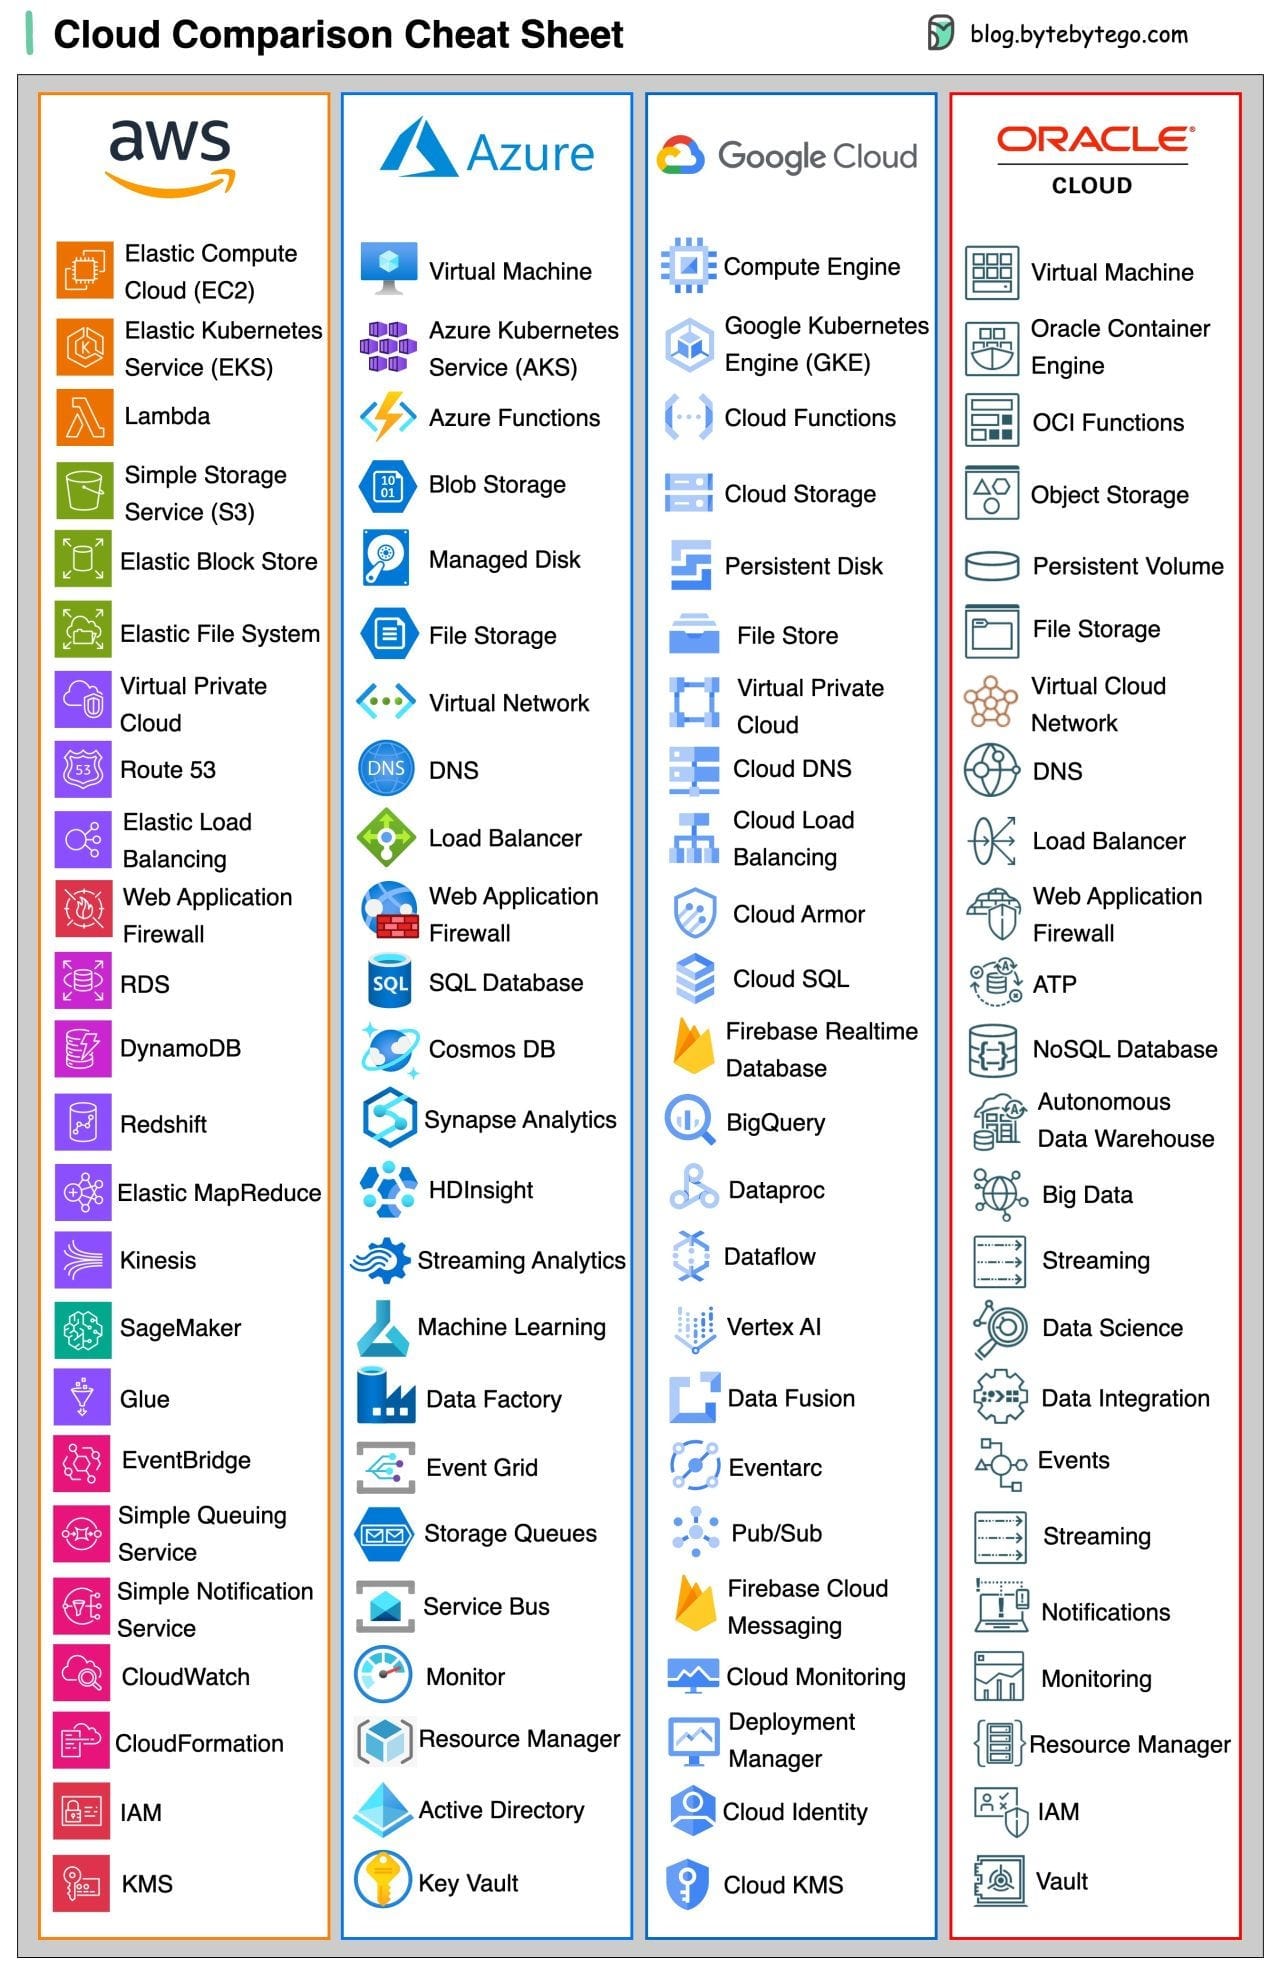
This naming divergence extends beyond compute - you'll find it in data storage, databases, and AI services. Most providers build their own branded dictionary that practitioners must learn.
You might think, "Why not use fundamental concept names instead of branded terms to simplify communication?" The answer is that in the data and AI domain, even basic terms like "pipeline," "product," or "model" carry different meanings across contexts.
The problem isn't just vendor branding - it's how technical terms evolve and get repurposed across domains.
The Bounded Context Principle
While established organizations rely on business glossaries as their terminology source of truth, it is not practical to have one in several situations (especially in 0-1 innovative work). Teams must actively align on technical definitions to move faster and build better solutions.
When innovating in the data and AI domain, you'll encounter terms that seem misleading or imprecise. Take "feature store" - it might feel like an odd name for a system that manages machine learning (ML) model inputs, but it's embedded in how ML practitioners communicate.
Unless you're shaping industry standards, adapting to established terminology is more practical than fighting it. Moreover, different domains may use identical terms to mean different things, and that's okay. What really matters is clear context mapping - explicitly defining how terms translate across domain boundaries.
This leads us to the bounded context principle from Domain-Driven Design (DDD) which is an important concept to grasp.
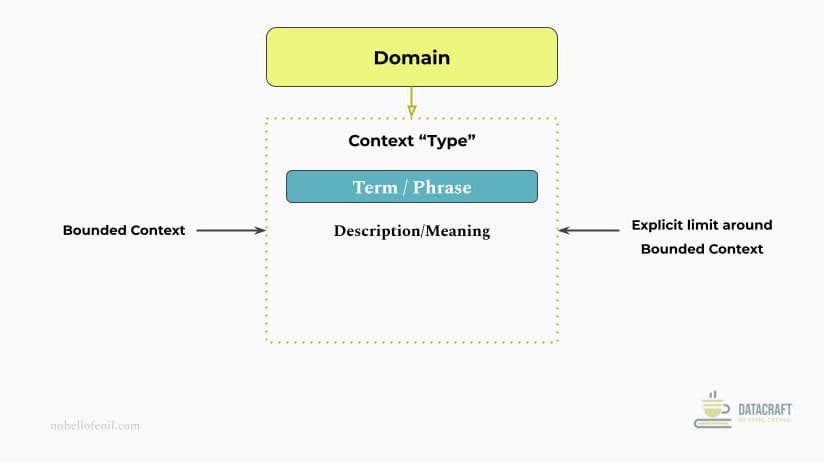
- Domain-Driven Design (DDD) says: Organize complex systems into separate domains, each with its own terminology and rules.
- The Bounded Context principle says: Let each domain use its own language internally, but define clear translations for cross-domain communication. Within each domain's boundary, a shared "ubiquitous language" is used, where terms have consistent meanings that everyone in that domain understands.
Clear translation is crucial for effective collaboration. When you're collaborating across different bounded contexts, remember to explicitly map the translations in your communication!
Real-World Examples
Business example
Different teams in product organizations interpret “customer” and “user” differently based on their context. The product team typically focuses on feature usage, sales team on licensing, and support team on issue resolution.
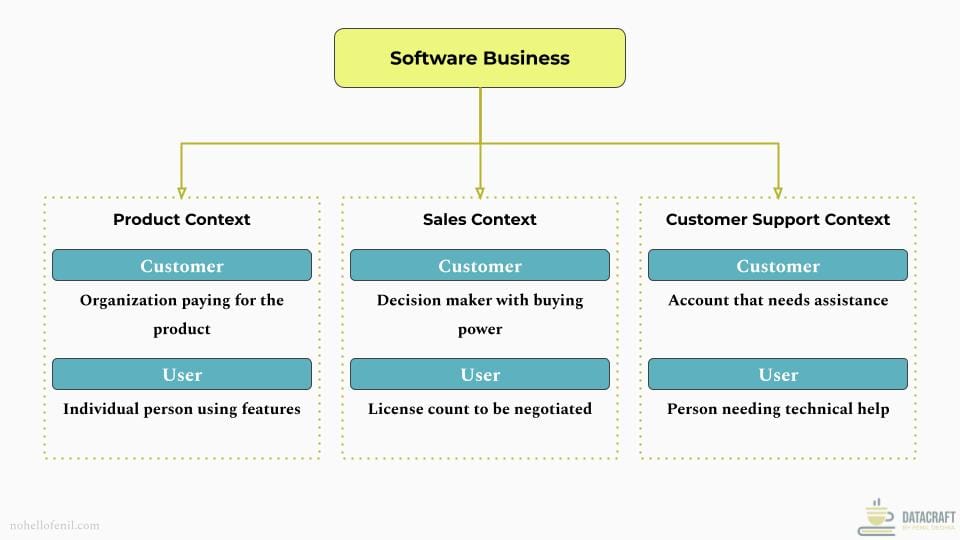
When product and sales teams collaborate on enterprise features:
- Product managers might say "Users need admin controls"
- Sales reps might say "Customers want flexible licensing"
- Translation: "Admin features let customers control user access and licensing"
Technical example
In the data and AI domain, "Pipeline" means different things across different teams - data movement for data engineering, model lifecycle for ML, and deployment automation for DevOps. Each context maintains its specific meaning while coordinating that context translation in your communications.
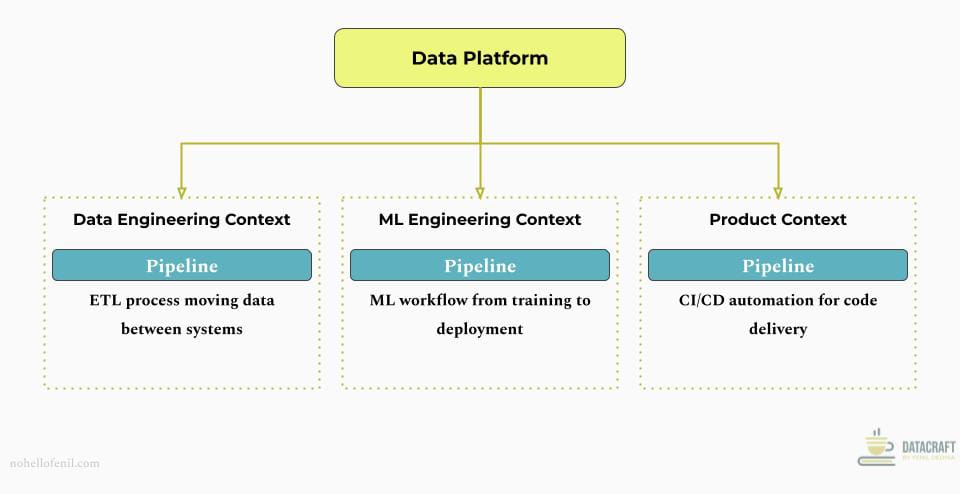
The focus area for each varies when it comes to 'pipeline':
- Data Engineering focus: Data flows, transformations, scheduling
- ML Engineering focus: Model lifecycle, experiment tracking, versioning
- DevOps focus: Build, test, deployment automation
When ML and data teams plan a new feature:
- ML team member might say "We need a pipeline for model retraining"
- Data Engineering team member says "We'll need a pipeline for feature engineering"
- Translation: "ML pipeline will consume outputs from data pipeline through defined interfaces"
Not the Same: Analogous Terms You're Using Interchangeably, But Shouldn't
Similar ≠ Same.
Unlike a Glossary where you lookup definitions one by one, I've taken a different approach: I organized terms in logical groupings because I've found it's most effective to learn new concepts by comparing them with similar terms. Use your judgment to skip or commit learning terms most relevant to the technical depth required in your role.
Category 1: Most Commonly Misinterpreted Terms
'Data Product' vs 'Data as a Product' vs 'Data Asset' vs 'Data Application' vs 'Data Platform'
Note: Given how often these terms are confused, we'll explore this distinction in more depth than others.
Data Product is a solution that delivers data-driven value to end users - it has clear users, use cases, and measurable value.
Examples:
- Stock trading app with real-time market insights
- Customer churn prediction system
- Credit scoring system
Data Platform provides infrastructure and services for core data operations.
Examples:
Storage and compute Platforms:
- Cloud-native: Snowflake, Databricks
- On-premises: Hadoop ecosystem
- Cloud provider: AWS (S3/Redshift), Google (GCS/BigQuery)
Metadata & Governance Platforms:
- Cloud-native: Atlan, Collibra
- Cloud provider: AWS Glue, Azure Purview
Data Assets are the raw or processed datasets that have business value.
Example: Customer transaction history, product inventory data, sales metrics, structured/semi-structured data, streaming data feeds.
Data Applications are software solutions built primarily to interact with data.
Example: A dashboard builder, a report generator, a data cleaning tool, ML model registries, data integration pipelines.
Data as a Product is the methodology of treating data like a product - with quality standards, documentation, and governance.
Example: Setting SLAs and ownership for customer data across an organization.
- Common confusion: These terms overlap because they're interconnected - platforms host assets, which power applications, which can be products, all potentially managed using data-as-a-product principles.
- Key difference: Think of it as layers!
- Data platform provides the foundation (like Snowflake)
- Data assets are the raw materials (like structured/unstructured datasets)
- Data applications are tools to work with data (like analysis tools)
- Data products deliver specific value (like a customer insights portal, or a recommendation engine)
- Data as a Product is how you manage it all (like product development practices)
Lets apply this layered approach of thinking these different terms to Netflix
- Netflix Data Platform: Cloud infrastructure
- Netflix Data Assets: User viewing history, content metadata
- Netflix Data Applications: Content management system
- Netflix Data Product: Recommendation engine
- Netflix Data as a Product: Quality metrics for recommendations, clear ownership, user feedback loops
Important context: The same component can play different roles depending on context.
- An ML model could be a data asset when used as a reusable component, but becomes a Data Product when deployed to solve specific user problems.
- A dashboard could be a data application when it's a generic tool, but becomes a data product when customized to deliver specific business insights.
- Integration pipelines could be data applications when they're tools for moving data, but become data products when packaged with a clear value proposition.
The key test is to ask:
- Does it store/hold data? → Data Asset
- Does it primarily process/manage data? → Data Application
- Does it deliver specific value to users? → Data Product
- Is it infrastructure that enables data work? → Data Platform
- Is it a methodology for managing any of the above? → Data as a Product
Category 2: Core Data Concepts
Data Governance vs Data Compliance vs Data Management
Data Governance is a framework that dictates how an organization manages, uses, and protects data assets through internal policies, standards, and controls. It ensures compliance, data quality, and security.
Data Management is the operational execution of data handling activities like storage, processing, and maintenance.
Data Compliance is adherence to external regulations and standards for data privacy and security (like GDPR, HIPAA).
- Common confusion: All three terms involve organizational data handling, often leading to unclear boundaries between setting internal policies (governance), executing them (management), and meeting external requirements (compliance). Governance and compliance are often conflated because governance is explicitly designed to ensure compliance - it's the proactive framework that enables compliance.
- Key difference: Think of it as: governance dictates the internal playbook, management executes it through tools and processes, and compliance validates against external requirements. Internal framework drives external compliance through operational execution.
- Example: For sensitive healthcare data, governance defines access policies (internal rules), management implements encryption and access controls (execution), and compliance ensures HIPAA requirements are met (external validation).
ETL vs ELT
ETL (Extract, Transform, Load) transforms data before loading it into the target system.
ELT (Extract, Load, Transform) transforms data after loading it into the target system.
- Common confusion: Similar acronyms and both handle data pipeline processes.
- Key difference: Timing and location of transformation. Think of ETL as pre-processing ingredients before cooking (like chopping vegetables), while ELT is adding raw ingredients to the pot and transforming them during cooking. Example: ETL transforms customer addresses into a standardized format before loading into a data warehouse, while ELT loads raw addresses and standardizes them using warehouse computing power.
Data Mesh vs Data Fabric vs Microservices
Data Mesh is an organizational and cultural approach treating data as a product, with domain teams owning their data assets and delivery.
Data Fabric is a technical architecture using metadata and automation to integrate and manage distributed data sources.
Microservices is an architectural style that structures an application as a collection of small, loosely coupled services. Each service is designed to perform a specific business function and can be developed, deployed, and scaled independently. While primarily known as an application development approach, microservices share interesting parallels with data mesh and fabric in their approach to distributed systems.
- Common confusion: All three approaches aim to address complexity in distributed environments, but they approach this challenge from different angles. They all fundamentally aim to make complex systems more manageable, flexible, and efficient. The choice between them—or more likely, a combination—depends on an organization's specific technical and cultural needs.
- Key difference: Data mesh tackles organizational complexity by restructuring how teams own and manage data. Data Fabric is about technical integration, creating a smart, adaptive data network (provides a unifying layer across different data sources). Microservices is about modular design (breaking down monolithic systems into focused services that are autonomous). So you can think of it as mesh focuses on organizational transformation of data ownership, fabric automates system connections, while microservices breaks down application architecture into independent, specialized services.
- Example: A retail company implements mesh by making each department responsible for their customer data products, fabric automates how these products connect and share data, and microservices creates independent services for user authentication, product catalog, and order processing.
Business Glossary vs Taxonomy vs Ontology vs Data Dictionary
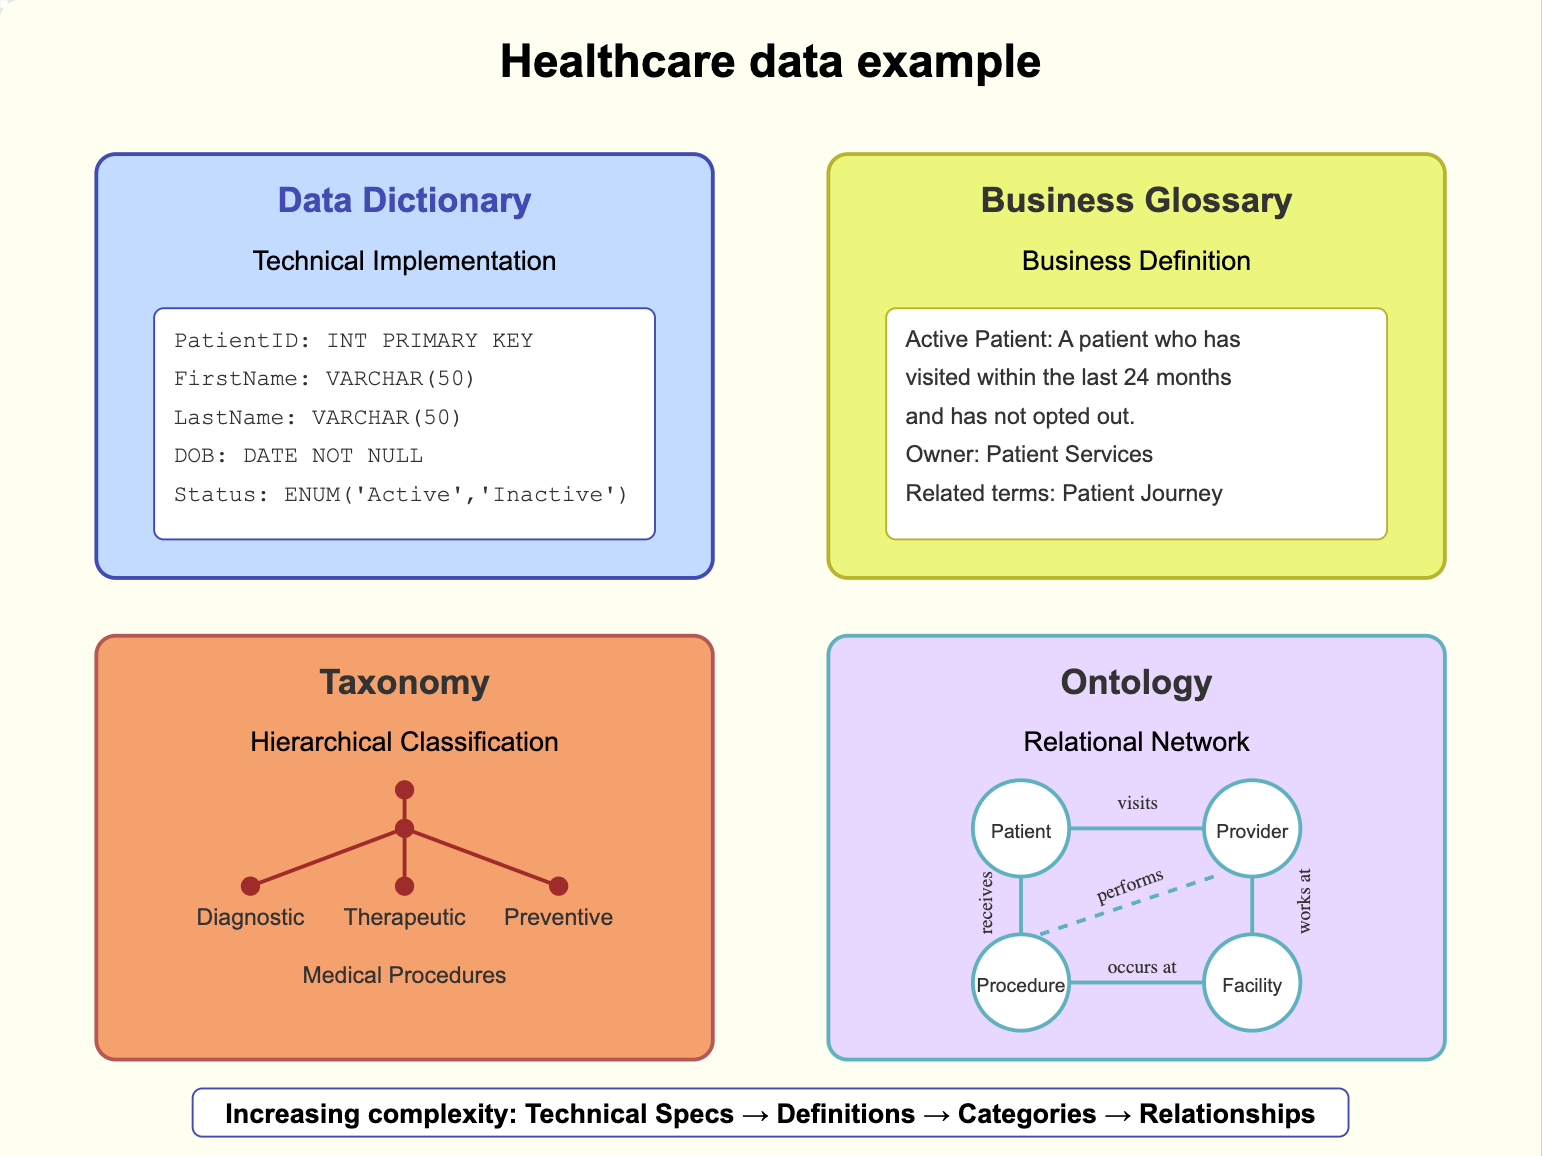
Data Dictionary is a technical reference that documents database structure - tables, columns, data types, and constraints.
Business Glossary is a curated dictionary of business terms with standardized definitions and ownership information.
Taxonomy is a hierarchical classification system organizing concepts into parent-child relationships, much like a filing cabinet.
Ontology is a comprehensive knowledge framework that defines concepts, relationships, and rules within a domain, similar to a network diagram.
- Common confusion: All four relate to organizing information, but serve different purposes and audiences.
- Key difference: Audience and complexity of relationships. Data dictionary specifies technical implementation, glossary defines business terms, taxonomy categorizes them, ontology establishes relationships. Think of it like: glossary is a dictionary (definitions), data dictionary is an engineering blueprint (technical specs), taxonomy is a filing cabinet (categories), and ontology is a network diagram (relationships).
- Example: In healthcare data, a data dictionary defines PatientID as INT PRIMARY KEY, a glossary explains what "Active Patient" means to the business, taxonomy classifies procedures into types (diagnostic, therapeutic, preventive), and ontology establishes that "patients receive procedures from providers at facilities" with rules governing these relationships.
Data Lake vs Data Lakehouse
Data Lake is a storage system for raw data in native format without schema enforcement.
Data Lakehouse is a hybrid architecture adding database features (ACID, schema enforcement) on top of a data lake.
- Common confusion: Similar names and base capabilities - both store large volumes of raw data and are often positioned as modern data storage solutions.
- Key difference: Lakes prioritize flexibility; lakehouses add structure and reliability. Think of a lake as a vast reservoir that accepts any type of data, while a lakehouse is like adding plumbing and filters to that reservoir.
- Example: Raw IoT sensor data goes into a lake, but when you need that data to be transaction-safe for business reporting, you'd use a lakehouse.
Data Infrastructure vs Data Architecture
Data Infrastructure is the physical components layer (hardware, software, networks) that stores and processes data.
Data Architecture is the blueprint defining how data assets are organized, integrated, and used.
- Common confusion: Both are foundational elements often discussed together in data strategy conversations.
- Key difference: Infrastructure implements; architecture designs. Think of architecture as the building blueprints, while infrastructure is the actual construction materials and systems.
- Example: Architecture specifies that real-time analytics needs a streaming pipeline, while infrastructure provides the actual Apache Kafka clusters to implement it.
Data Quality vs Data Reliability
Data Quality is the measure of data's accuracy, completeness, consistency, and fitness for intended use.
Data Reliability is the consistency and stability of data over time, including system uptime and data delivery.
- Common confusion: Both relate to data trustworthiness, leading to quality metrics being confused with system reliability measures.
- Key difference: Quality measures correctness; reliability measures consistency. Think of quality as checking if ingredients are fresh and properly measured, while reliability is ensuring the kitchen operates without interruption.
- Example: Data quality ensures customer addresses are accurate, while reliability ensures the address database is consistently available.
Data Catalog vs Data Discovery vs Metadata Management
Data Catalog is an organized inventory of data assets that includes descriptions, ownership, and lineage information.
Data Discovery is the process of finding and understanding available data assets across an organization.
Metadata Management is the systematic organization and maintenance of metadata (data about data) across systems.
- Common confusion: These terms often overlap because they work together - catalogs use metadata to help with discovery, leading to unclear boundaries between the inventory system (catalog), the search process (discovery), and how the supporting information is maintained (metadata management).
- Key difference: Catalogs provide the interface, discovery is the user activity, metadata management maintains the supporting information. Think of it as a library where the catalog is the searchable index system, discovery is how you find books you need, and metadata management keeps track of all book details like authors, locations, and categories.
- Example: When a data scientist needs customer information, they use the catalog interface to search (catalog), explore available datasets to find what they need (discovery), while metadata management ensures all the dataset descriptions and relationships are accurate and up-to-date.
Data Marketplace vs Data Exchange vs Data Catalog
Data Marketplace is a platform for buying and selling data products with standardized terms and monetization.
Data Exchange is a controlled environment for peer-to-peer data sharing between trusted partners.
Data Catalog is an organized inventory of data assets that includes descriptions, ownership, and lineage information.
- Common confusion: All facilitate finding and accessing data, but serve different purposes in data commerce and discovery.
- Key difference: Marketplaces enable commerce, exchanges facilitate sharing, catalogs provide inventory. Think of it like: marketplace is an e-commerce site (commercial transactions), exchange is a trading platform (partner sharing), catalog is a library index (asset discovery).
- Example: A marketplace sells consumer insights data, an exchange shares supply chain data between partners, a catalog helps employees find internal datasets.
Data Observability vs Data Monitoring
Data Observability is the ability to understand the health and state of data in your systems by measuring quality, reliability, and lineage.
Data Monitoring is the continuous tracking of specific data metrics and system performance against predefined thresholds.
- Common confusion: Both involve watching data systems, leading to observability being seen as just another word for monitoring.
- Key difference: Observability enables understanding; monitoring tracks specifics. Think of observability as a full health checkup that helps diagnose issues, while monitoring is checking specific vital signs.
- Example: Observability helps understand why data quality dropped by showing lineage and dependencies, while monitoring alerts when quality scores fall below 90%.
Data Security vs Data Privacy
Data Security is a framework that dictates how an organization protects data against unauthorized access, corruption, or theft through technical controls and measures.
Data Privacy is adherence to appropriate data use and handling according to user consent rights and regulatory requirements.
- Common confusion: Similar to the earlier discussion of data governance and data compliance, security and privacy are interconnected - security provides the protective framework that enables privacy, leading to them often being conflated.
- Key difference: Data security dictates and implements data protection, Data privacy ensures appropriate use. Think of it like our earlier data governance model: security provides the internal controls (governance), implementation happens through tools and processes, and privacy ensures compliance with user rights and regulations (compliance).
- Example: For user data, security implements encryption and access controls (protection), while privacy ensures data collection and use aligns with user consent and regulations (appropriate use).
Data Contract vs Data SLA
Data Contract is a formal specification that defines data structure, format, semantics, quality, and terms of use between data providers and consumers.
Data SLA (Service Level Agreement) specifies measurable targets for data service performance like availability, latency, freshness, and support response times.
- Common confusion: Data Contracts are often mistaken as just performance agreements, when they're actually broader specifications that may include SLAs as one component.
- Key difference: Contracts define what's being delivered; SLAs measure how well it's delivered. Think of it like ordering a meal - the contract specifies the dish ingredients and preparation (what you get), while the SLA guarantees delivery time and temperature (how well you get it).
- Example: A data contract specifies customer data fields and access controls, while the SLA guarantees 99.9% availability and max 24-hour data freshness.
Category 3: Data Movement & Processing
Data Integration vs Data Pipeline vs Data Ingestion vs Data Workflow
Data Integration combines different data sources into a unified view while maintaining data quality and relationships.
Data Pipeline is a series of processing steps that transform and move data from source to destination (including the technical act of loading data into target systems, often called 'Data Loading').
Data Ingestion is the initial process of bringing data into a system from external sources.
Data Workflow orchestrates and schedules the execution of data-related tasks and their dependencies.
- Common confusion: These terms are often used interchangeably because they all involve data movement, but each serves a distinct purpose in the data lifecycle.
- Key difference: Each term represents a different scope and purpose. Think of building a house: ingestion brings raw materials (initial import), pipelines are the conveyor systems moving and transforming materials (data flow and loading), integration combines materials into cohesive structures (unified view), and workflow is the construction schedule ensuring everything happens in the right order.
- Example: In an e-commerce system - ingestion pulls raw data from various sources like sales and inventory, pipelines transform and load it into the data warehouse, integration combines it into a unified customer view, and workflow orchestrates the entire process including dependencies and scheduling.
Data Sharing vs Data Replication vs Data Collaboration
Data Sharing is providing controlled access to data while maintaining a single source of truth.
Data Replication is creating and maintaining copies of data across different locations or systems.
Data Collaboration is enabling multiple parties to work together on shared data assets with governance controls.
- Common confusion: All involve multiple parties accessing data, leading to confusion about when to use each approach.
- Key difference: Sharing controls access, replication duplicates data, collaboration enables joint work. Think of it like: sharing is giving someone view access to your document (controlled access), replication is making copies of the document (distributed copies), and collaboration is using a platform where multiple people can work on the document together (joint workspace).
- Example: For customer data, sharing gives partners read access to your database, replication copies data to their system, collaboration lets you jointly analyze and enrich the data.
- Let's examine data sharing through modern tooling:
- Snowflake's data sharing feature:
- What it does: Direct sharing of read-only data without copying/moving data
- Common confusion: Often confused with data replication or ETL-based sharing.
- Key difference: Live access vs copying data. Think of it like streaming a movie (data sharing) versus downloading it (data replication). Example: A retailer shares daily sales data with suppliers - suppliers query live data through Snowflake shares instead of receiving copied data dumps.
- Provider maintains single source of truth while consumers query live data.
- Key mechanisms: Shares (datasets), Reader Accounts (access control), Secure Data Sharing (governance)
- Atlan's metadata sharing capability:
- What it does: Shares context, governance, and knowledge about data across teams
- Common confusion: Often mixed up with sharing the actual data.
- Key difference: Shares knowledge about data vs sharing data itself. Data teams share dataset descriptions, quality metrics, and usage patterns through Atlan while actual data remains in source systems.
- Enables collaboration on metadata like descriptions, classifications, and lineage.
- Key mechanisms: Asset sharing, Active metadata, business glossary
- Snowflake's data sharing feature:
Streaming Data vs Real-time Data
Streaming Data is the continuous flow of data processed incrementally as it arrives, analyzed through stateful operations like windowing and aggregations using tools such as Apache Flink or Spark Streaming.
Real-time Data is data processed and made available for use immediately after creation, using in-memory processing for instant analysis through tools like Apache Kafka ksqlDB or Redis.
- Common confusion: Both terms suggest immediate data processing, leading them to be used interchangeably. They are also confused in an analytics context where streaming requires state management while real-time focuses on immediate event processing.
- Key difference: Streaming defines data flow pattern; real-time defines speed requirement. Think of it like: streaming is like a river's continuous flow requiring monitoring over time (constant data with windowed analysis), while real-time is like instant messaging needing immediate responses (immediate event processing).
- Example: IoT sensor data streams continuously with rolling analytics over 5-minute windows, while payment processing requires real-time transaction validation for instant fraud detection.
Data Transformation vs Data Processing
Data Transformation converts data from one format, structure, or value to another.
Data Processing is the broader sequence of operations performed on data, including cleaning, transformation, analysis, and storage.
- Common confusion: Transformation is often mistaken as synonymous with all processing activities.
- Key difference: Transformation is a specific operation; processing is the complete workflow. Think of it like: transformation is translating a document (format change), while processing is the entire editorial workflow.
- Examples: Converting timestamps to standardized UTC format is transformation, while the full ETL pipeline is processing. In retail data - transformation is converting product SKUs to standardized formats or euros to dollars, while processing includes data ingestion from Point of Sales (POS) systems, cleaning returns data, joining with inventory, aggregating sales, and loading to the data warehouse.
Category 4: ML/AI
AI vs ML vs Deep Learning
AI (Artificial Intelligence) is the broad field of creating systems that can simulate human intelligence.
ML (Machine Learning) is a subset of AI focused on algorithms that learn from data without explicit programming. It is more specifically a Learning Approach in the field of AI.
Deep Learning is a specialized ML implementation strategy using neural networks with multiple layers. It is one of the many methodologies/strategies that can be used to implement a specific Learning Approach within the field of AI.
Want to master AI fundamentals? Decomposing AI Development is your fast track.
- Key difference: Scope and specialization.
Think of it like: AI is transportation (many ways to get somewhere), ML is vehicles (learning from data to navigate), and deep learning is a specific type of vehicle design (layered neural networks) best suited for complex tasks.
AI Automation vs AI Agents
AI Automation refers to systems that follow predefined rules for repetitive tasks, using rule-based logic and pre-set workflows. Examples: Automated email marketing, Lead scoring systems, Data cleansing tools, Routine pipeline updates.
AI Agents are autonomous entities capable of learning, adapting, and making decisions in real time using advanced machine learning or deep learning algorithms. Examples: Conversational chatbots, Predictive forecasting tools, Dynamic personalization systems, Autonomous decision-making assistants.
- Common confusion: Both terms involve artificial intelligence, leading to misconceptions that automation is always "intelligent" or that agents are simply advanced automation.
- Key difference: Automation follows fixed rules; agents learn and adapt. Think of automation as a thermostat that turns on/off at set temperatures (rule-based symbolic learning), while agents are like smart thermostats that learn preferences and adjust proactively (adaptive learning).
Model Training vs Model Fine-tuning
Model Training builds a model from scratch using a full dataset.
Model Fine-tuning adjusts a pre-trained model for specific tasks or domains.
- Common confusion: Both involve learning from data but serve different purposes.
- Key difference: Starting point and resource requirements. Think of it like: training is building a car from parts (full build), fine-tuning is customizing an existing car (adjustments). Example: Training GPT from scratch vs fine-tuning it for medical terminology.
Model Serving vs Model Deployment
Model Serving provides machine learning models through APIs for real-time predictions.
Model Deployment is the broader process of making models available in production environments.
- Common confusion: Often used interchangeably in MLOps discussions.
- Key difference: Serving is a component of deployment. Think of it like: serving is the restaurant's kitchen (prediction service), deployment is running the entire restaurant (full production system).
- Example: Model serving via REST API vs full deployment including monitoring and scaling. A fraud detection model's serving layer provides real-time predictions via REST API, while deployment includes the entire production system - API endpoints, monitoring dashboards, A/B testing framework, automated retraining pipeline, and rollback procedures.
Feature Engineering vs Feature Selection
Feature Engineering creates new meaningful features from raw data.
Feature Selection chooses the most relevant features for a model.
- Common confusion: Both modify feature sets but serve different purposes.
- Key difference: Creation vs reduction. Think of it like: engineering is crafting new ingredients (creation), selection is choosing the best ingredients (reduction).
- Example: Creating interaction terms from variables vs selecting top predictive features. In e-commerce, engineering creates features like "days_since_last_purchase" and "avg_cart_value" from raw transaction data, while selection identifies that "avg_cart_value" is more predictive than "browser_type" for customer churn prediction.
Model Registry vs Model Store
Model Registry tracks model versions, metadata, and lineage with governance.
Model Store is a simpler repository for saving model artifacts.
- Common confusion: Both store models but with different capabilities.
- Key difference: Registry provides governance and tracking, store provides storage. Think of it like: registry is a bank vault with detailed records (tracked storage), store is a safety deposit box (basic storage).
- Example: MLflow Model Registry with versioning vs simple S3 bucket storage.
Category 5: Analytics
Data Analytics vs Business Analytics vs Data Science
Data Analytics extracts insights from data using statistical methods and tools.
Business Analytics applies data analysis specifically to business problems and decisions.
Data Science combines analytics, programming, and domain expertise to build predictive models and data products.
- Common confusion: Overlapping skills and tools lead to unclear boundaries.
- Key difference: Focus and scope of analysis.
Think of it like: analytics answers "what happened," business analytics answers "what should we do," data science answers "what will happen."- Example: Analytics shows customer churn rates, business analytics recommends retention strategies, data science builds prediction models.
Data Visualization vs Business Intelligence (BI)
Data Visualization is the graphical representation of data and insights.
Business Intelligence is a comprehensive approach to collecting, analyzing, and presenting business data for decision-making.
- Common confusion: Visualization is often seen as equivalent to BI because it's the most visible component.
- Key difference: Visualization is a communication tool; BI is an end-to-end solution. Think of it like: visualization is the presentation slides, BI is the entire quarterly business review process.
- Example: A scatter plot showing customer segments is visualization, while Tableau dashboards with drill-downs, KPIs, and automated reporting is BI.
Streaming Analytics vs Real-time Analytics
Streaming Analytics processes continuous data flows using time windows and stateful operations.
Real-time Analytics delivers instant insights on individual events as they occur. It performs immediate analysis on data at the edge as it's generated.
- Common confusion: Both handle immediate data but differ in processing patterns.
- Key difference: Streaming data analytics handles continuous flows with micro-batching, whereas real-time analytics handles discrete events.
Think of it like: streaming is monitoring highway traffic patterns (continuous), real-time is detecting individual speeders (immediate events). - Examples:
- Streaming: In a manufacturing plant - analyzing 15-minute windows of production line sensor data to detect quality trends (50,000 readings/minute) is streaming analytics.
- Current "Real-time": Instant machine failure detection from individual anomalous readings (near real-time).
- True Real-time (still technologically challenging): Simultaneously analyzing every sensor reading from every machine across multiple global plants (petabytes of data) with zero latency.
Appendix
Who is this post for?
Non-engineers looking to build a strong understanding (and just enough data vocabulary) to communicate like seasoned data professionals. Whether you're in product management, marketing, sales, or UX, if you're working in data/AI, you need strong technical understanding to successfully build, market, and sell your product.
How to make the best use of it?
There are levels to it, of course. Technical knowledge requirements vary by role - what a product manager needs differs from an executive or product Marketer. But terminology is ground zero - prioritize building a shared understanding first to accelerate higher-value work.
I've organized terms in logical groupings because I've found it's most effective to learn new concepts by comparing them with similar terms. Use your judgment to prioritize learning terms relevant to your role.
Consider bookmarking and sharing if you find this useful. Feedback is always encouraged! It helps me provide more value to you and improve my writing process. You can reach out on LinkedIn (please include a note) or write to me at fenil.h.dedhia@gmail.com.
Why did I write this post?
As a Product Lead doing innovation/R&D work for more than 6 years, I've learned that clear technological communication requires more than just choosing the right words. As a product manager or similar role, you need to constantly bridge the gap between what you say and what others hear. Just like how a writing culture requires a reading culture, building a shared understanding around terminology demands active participation from all key stakeholders.
I wish I had this resource over the past two years. Not finding a practical, comprehensive resource covering common terms across the full data lifecycle motivated me to create this guide.
Technical terminology can silently drag down team productivity and velocity.
Experience proves this point - spend just a few years working full-time on technical products/projects and you'll see it firsthand. If you're interested in reading more about it from a research perspective, check out the links below.
Sources:
- Research from Haystack demonstrates how lack of shared context and terminology directly impacts productivity through miscommunication and conflict.
- Mental health research highlights that maintaining expertise - including domain terminology - through continuous learning is crucial for preventing burnout in rapidly evolving tech fields. Self-efficacy through reskilling and upskilling helps professionals stay effective.
- Technical domains (like Data & AI) face the greatest impact, especially in fast-paced environments like startups and innovation/R&D teams. The impact multiplies when team members are new to the domain - varying technical depth and terminology gaps create daily friction that slows progress.
- The Accenture and Qlik research highlights that a lack of data skills contributes to employee stress and productivity loss.
- According to IDC, the average knowledge worker spends about 2.5 hours per day, or roughly 30% of their workday, searching for information.
Member discussion